Strokes Gained Putting and much more

“It’s complicated” could be the relationship status between people and statistics. On the one hand, they love them because everything gains credibility through statistics. Someone winning a tournament is great, but think about a player winning the tournament by +5.2 Strokes Gained off the Tee. It has a nicer ring to it, right? On the other hand, people easily get frustrated with statistics because there are so many fallbacks. How can someone gain .2 of a stroke? Where does this number come from? What is the relation this number is set to? Does that mean the player that won by three strokes total, actually lost 2.2 strokes in other areas of his game compared to the rest of the field? In today’s blog, we are going to look at the PGA Tour putting statistics and see if putting really is as important as some want us to believe.
Nowadays, golf fans get confronted with all kinds of statistics. The amount of data the PGA Tour collects and offers to its viewers is incredible. At the same time, it is fairly complicated to make sense of all the numbers that are given to you. In total, the PGA TOUR offers eight categories in the area of putting. Namely, they are: Strokes Gained Putting, One-Putts, Three-Putts, All Putts made by Distance, Green in Regulation Putts made by Distance, Putts per Round, Putting Averages, and Average Putting Distance. We will take a look at all of them, work you through the numbers and help you in determining the best putters in the world as well as per tournament. Giving you the opportunity to really impress your peers next time they try to talk statistics to you.
What is Strokes Gained Putting?
Before we get started it is important to know that all of the following statistics have flaws. It is simply not possible to paint a complete picture of reality and the biggest challenge is to make different tournaments and fields comparable to each other in a way, that you could just pick the top player on a statistic and say that is the best putter. But don’t worry, we will help you out.
The first statistic that we are going to look at is the one that is used the most because it also is the one that factors in the most aspects. It is called Strokes Gained Putting. If you watch tournaments regularly, you will hear commentators say “player x gained however many strokes putting yesterday”. But what does that actually mean? If you look at the statistics page of the PGA Tour you will find the following explanation:
“The number of putts a player takes from a specific distance is measured against a statistical baseline to determine the player’s strokes gained or lost on a hole. The sum of the values for all holes played in a round minus the field average strokes gained/lost for the round is the player’s Strokes gained/lost for that round. The sum of strokes gained for each round is divided by total rounds played. The Strokes Gained – concept is a by-product of the PGA TOUR’s ShotLink Intelligence Program, which encourages academics to perform research against ShotLink statistical data. Professor Mark Broadie from Columbia Business School developed the early concept which was later refined by the TOUR” – pgatour.com
In case you feel no smarter than before you read this, you are welcome, and it is probably exactly how most people feel. Again, in terms of putting stats, this is the most complicated because they tried to figure in all kinds of problems that usually occur with other stats.
What kind of problem are we talking about? Let us explain. If you want to know who is the best putter, then why not simply look at how many putts a player usually needs? Easy, right? But is someone who missed a green, chipped it close, and holed the putt consequently a better putter than someone who hit the green and two-putted? Going solely by the total amount of putts, the answer to the question would be yes. However, that is clearly not the case.
The next step could be to look at greens in regulation and check how many putts were made from there. This would take out the possibility of someone chipping it close. Here, you will quickly run into a different problem. Namely, not knowing from what distances those putts occurred and how difficult the putts might have been. Meaning, if you need fewer putts than your fellow competitor, does that truly mean you are a better putter? Or does it mean you hit better shots into the green, making you a better iron player rather than a better putter? Or maybe you left the ball consistently underneath the hole, generally leaving you easier putts, whereas your playing partner had a double breaker, downhill putt from the same distance. In case you both hole out, there would be no way to determine which one of you is the better putter. You see, statistics are only valuable to the one who is able to understand them. In order to be able to comprehend statistics, it is therefore essential to know about possible flaws.
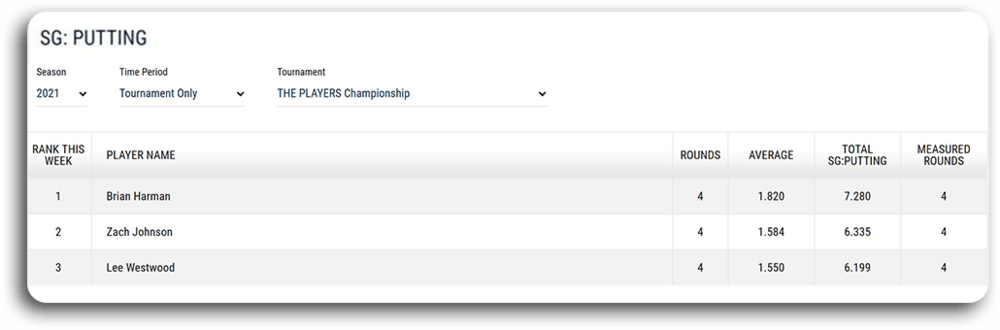
Let’s have a look at a specific example from the Players Championship. Bryan Harman led the field in Strokes Gained Putting that week with a score of +7.28. As most of you probably know, the PGA Tour and its partners are able to record every single shot played by any player. The Strokes Gained Putting statistic uses a certain value that is assigned to a putt, factoring in difficulty, distance, and tournament field performance.
That means, if you hit the green on 17 at TPC Sawgrass the data will suggest how many strokes you will need from your specific spot to get the ball into the hole. To make it a little more simple we will assume even numbers. If the statistical data determined you will make a two-putt from your location and you hole the putt, you consequently gain one stroke towards the rest of the field. If you three-putt, you lose a stroke.
At the end of each round, the field average score is subtracted from the total sum of a player’s Strokes Gained/Lost score and upon tournament completion divided by the total number of rounds played. So, what is the Strokes Gained statistic telling us? It tells you, how well you putted from various distances compared to the rest of the field. But does it tell you, who the best putter is in general? The simple answer is - kind of.
What is the anatomy of a good putter?
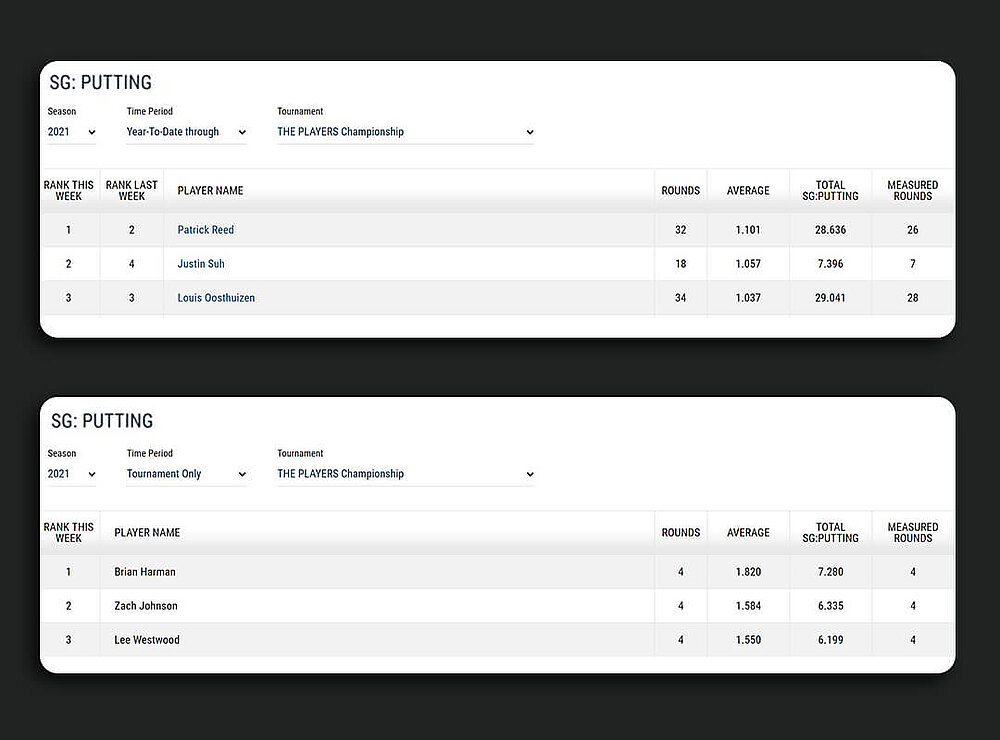
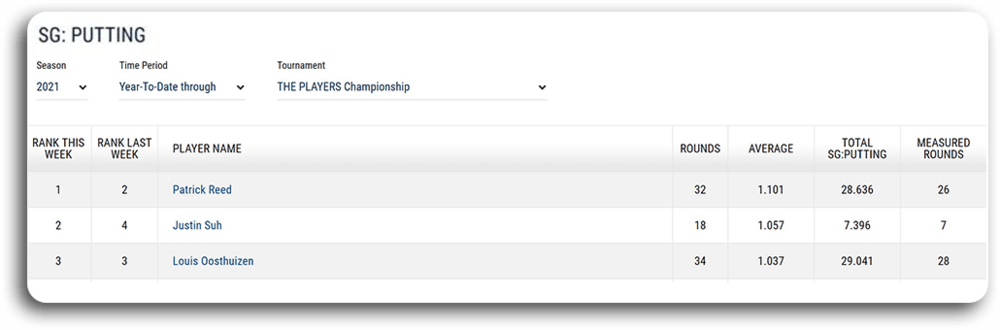
What that means becomes a little bit more apparent, if you take a look at the current world ranking (after The Players Championship) and the Strokes Gained Putting Year-to-Date (NOTE: With all statistics, you can filter either for tournament only or Year-to-Date). Patrick Reed (World Ranking:7) leads the Strokes Gained Putting statistic before Justin Suh (WR: 373), followed by Louis Oosthuizen (WR 23).
The odd one out in this statistic is clearly Justin Suh, who apparently putted very well compared to the rest of the field during the seven rounds that were measured for this statistic. But is he really a better putter than Louis Oosthuizen who has a total of 28 rounds measured? In this case, the biggest problem when it comes to comparability is, that the tournaments are not the same and do not feature the same fields. Oosthuizen and Suh only played the Shriners Open together and in general, the strength of the field is not a factor in that statistic.
While a tournament in itself is highly comparable, two tournaments with different fields are not. For example, if you manage to gain +5 strokes in a field that features the top 50 players in the world, it is probably going to be a better putting performance than if you manage to gain +5 strokes in a not as elite field.
Let’s have a look at some of the other statistics. There is a total of seven categories other than Strokes Gained that can be found in terms of putting on the official PGA Tour website. Before we start to look at them, we have to ask ourselves what is the anatomy of a good putter? Generally, a good putter holes a lot of putts.
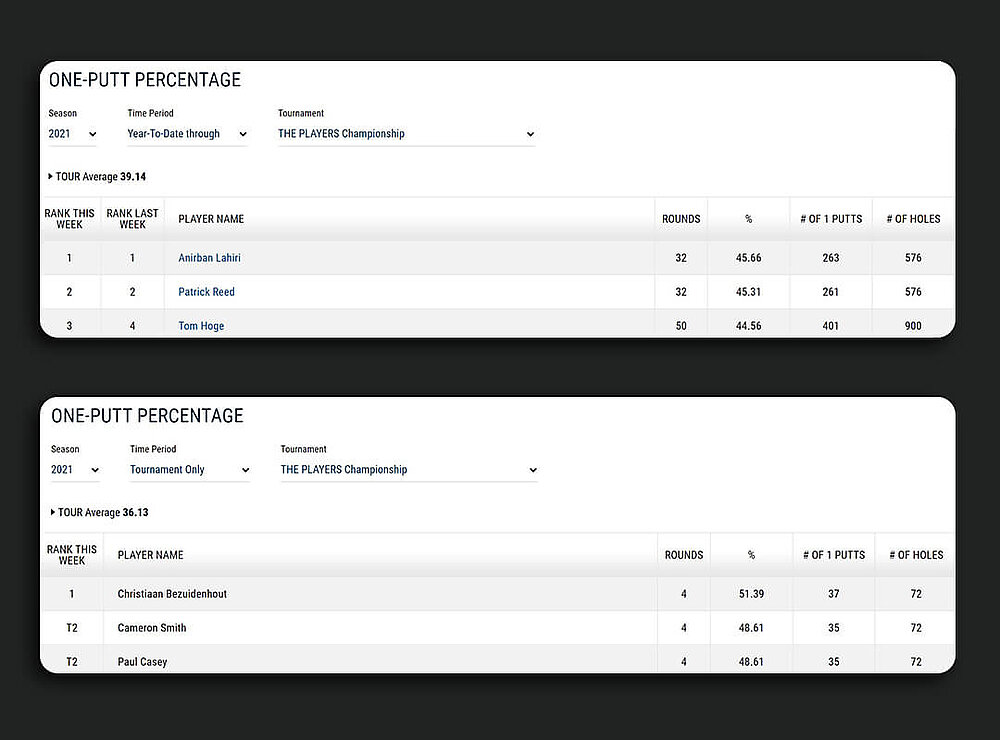
Luckily, the PGA Tour offers a statistic that is called One-Putt-Percentage. The Year-to-Date leaderboard here is topped by Anirban Lahiri. A 33- year-old Indian who has one top ten finish this season at the Corales Puntacana Resort & Club Championship and is ranked number 462 in the world. Lahiri managed to one putt 263 times in 32 rounds. The question that arises immediately is, from where did he one-putt? Did he miss the green a lot and chipped close, or is he a superb iron player who hit the ball close every time? Neither in terms of a single tournament nor in general, is that statistic able to provide enough information to provide comparability.
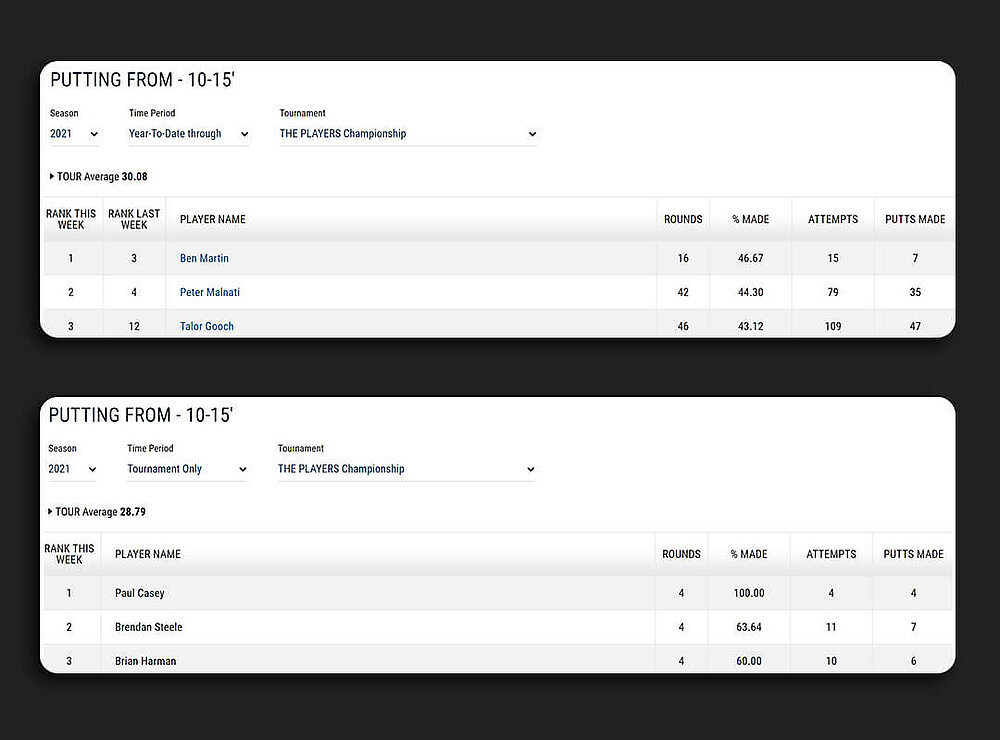
What, if we take into account a certain distance? Assuming that players are generally good within 5 feet to the hole and that longer putts of more than 15 feet amount more to luck than actual skill, we now look at Total One-Putts 10-15 feet. Because if you are able to one putt from there, surely you can gain many strokes towards the rest of the field. It is important to note, that only putts that were measured by a laser are counted in that statistic.
Unfortunately, there is no way of finding out where lasers are placed and why sometimes there are no lasers. For the time being, however, it is enough to know that the data collected here might not be complete. The stat One-Putts 10-15 feet Year-to-Date is led by Sungjae Im who holed a total of 51 Putts this season from that distance. That number is set into relation to all one-putts to give you the information that 13.5 % of all one-putts made by Im were in the distance of 10-15 feet. This is compared to the 50 one-putts that amount to 15% of all one-putts made by Lanto Griffin (2nd).
The problem here is, that the relation is only set to the total amount of one-putts, not however to the number of rounds. Griffin played 50 rounds and made 50 one-putts in that distance, whereas Im played 64 rounds and made 51 putts. Still, Im’s performance is ranked higher than Griffin’s because his total is greater than Griffin’s. No matter if you look at it from a world ranking point of view or only one tournament, the stat lacks, among other things, the information of the attempts made.
Scrolling down the page, you will quickly wonder what is the difference between One Putt 10-15 feet and All Putts Made 10-15 feet? Unlike in the statistic above, here you can find the percentage of putts made in relation to the actual attempts in that distance. Let’s take another look at this year’s Players Championship.
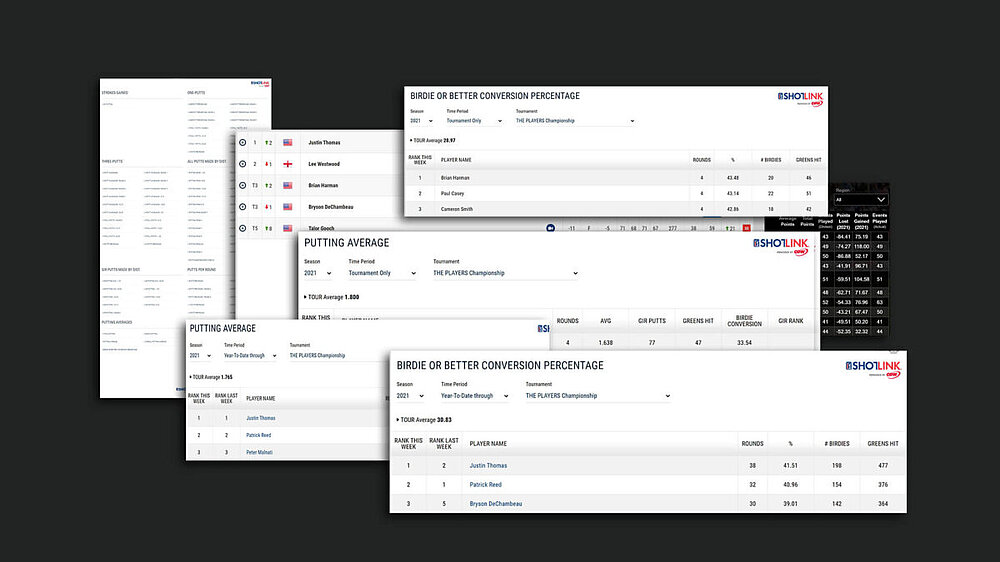
In this category, Paul Casey leads the field with four out of four putts made and later finished T5. Second is Brandon Steele, who finished T41, with seven out of eleven putts made from that distance, and Bryan Harman, who made six out of ten and finished T3. You can easily determine that Casey and Harman capitalized on their good performance in that category, ultimately aiding them on the way to a high finish. Steele on the other hand apparently struggled with other aspects of his game that led to him not being able to have a higher finish despite his good performance on the green from that distance.
When looking at the Year-to-Date version, however, we encounter another problem. Ben Martin, currently the world number 488, leads this stat because he managed to hole seven out of 15 attempts. However, there is no way of comparing 15 attempts in 16 rounds with the 79 attempts in 42 rounds of Peter Malnati (WR 157). Simply adding up the number of attempts throughout tournaments and setting them into relation to the putts made, leaves out too many factors. Is it better to have fewer attempts possibly meaning that I consequently had shorter putts those times I didn’t hit it to that distance? Or is it a good indicator to leave the ball at this distance a lot, therefore making me the best putter if I lead this statistic?
What matters most?
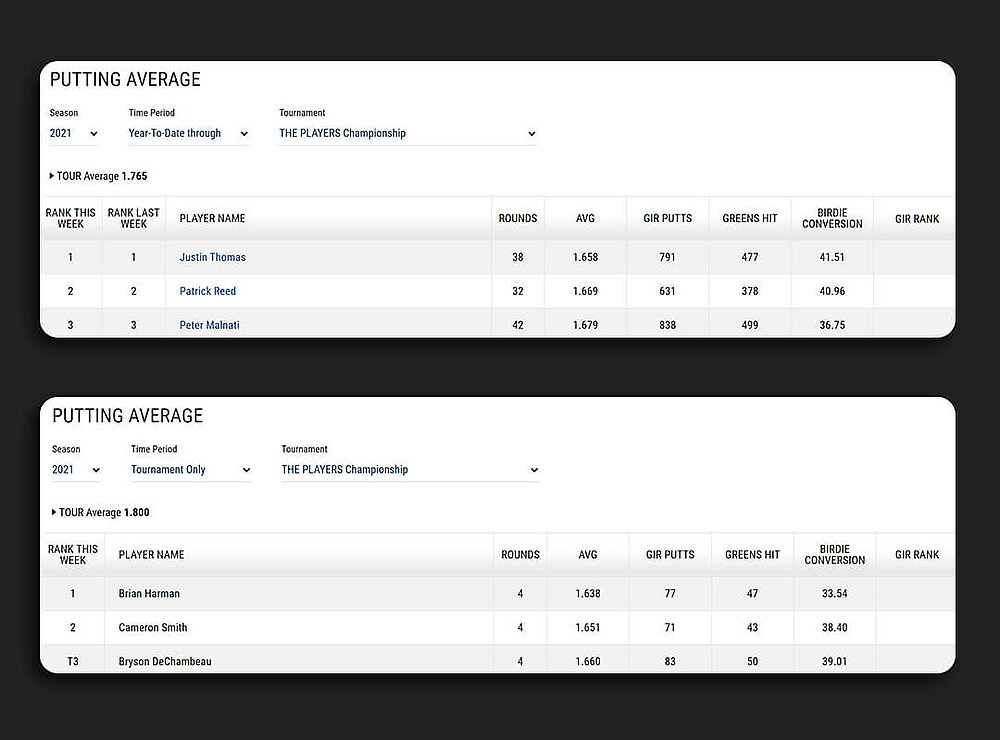
We will skip over the Putts per Round stats because they leave out too many important factors, as well as the Average Putting Distance because the numbers again are not comparable. This leads us to the last category namely Putting Average. The nice part here is, that the stats in that category also take into account the greens hit in regulation. Going back to our thoughts of what makes a player a better putter than another, we figured that a lower putting average per GIR will separate you from the rest of the field.
At the Players Championship Bryan Harman (T3) led with an average of 1.638 before Cameron Smith (T17) with 1.651 and Bryson DeChambeau (T3) with 1.660. While the margins are very slim and again difficulty, as well as distances, are not a factor, there is a correlation between that performance and the tournament finish. Obviously, this is the case, because a low average means fewer strokes than the rest of the field. In terms of world rankings this stat is led by Justin Thomas (2) followed by Patrick Reed (7) and Peter Malnati (157), also showing a correlation between world rankings and performance in this category. Noteworthy is Peter Malnati, because of his high world ranking in comparison to Thomas and Reed.
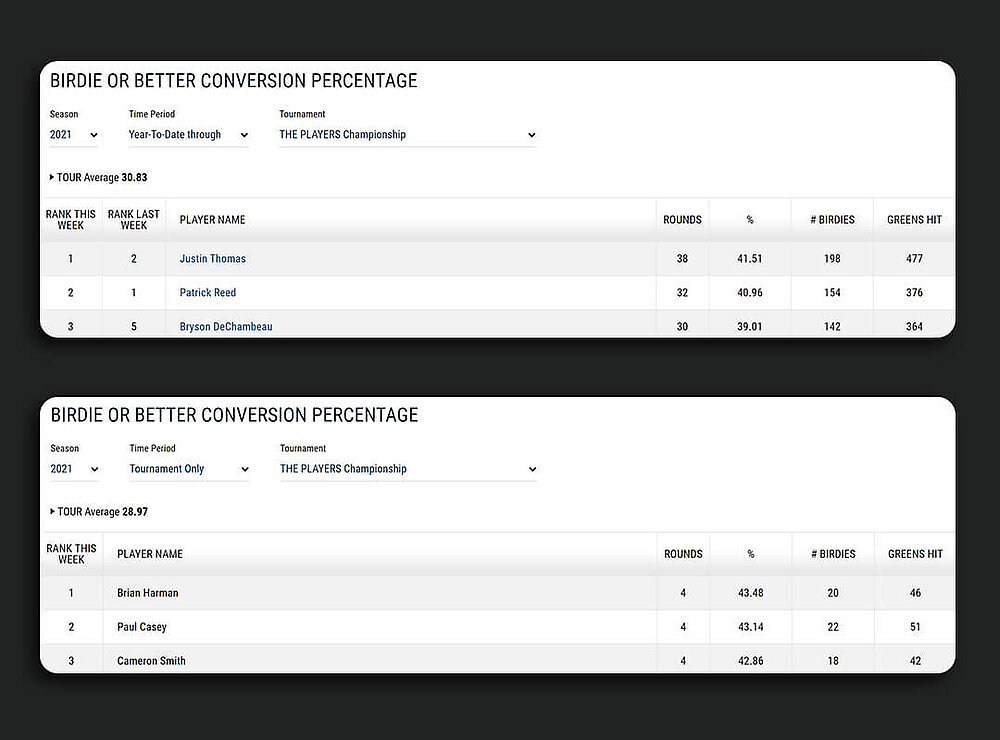
This emphasizes that being a good putter does not automatically make you a world-class player. One last factor of being a good putter is the Birdie Conversion Rate per Green in Regulation. Of course, there are other factors such as how close you hit your approach shot that does play a role in determining if one player is a better putter than another, yet are not represented in that statistic. In general, however, it is a fair assumption that if you have a good birdie conversion rate, you are also at least a decent putter and in terms of difficulty of a putt, you probably encountered some easy, and some more difficult putts. The conversion rate is calculated by setting the number of greens hit into relation to the actual number of birdies or better made.
At the Players Championship Bryan Harman again had the best performance with 43.48%, followed by Paul Casey with 43.14% and Cameron Smith with 42.86%. The assumption that the conversation rate does factor in, is also underlined by looking at the Year-to-Date stat. World Number two Justin Thomas leads the field before Patrick Reed and Bryson DeChambeau, all of whom are inside the World Top Ten. This is the stat that actually shows the biggest correlation with the world ranking, simply because despite its flaws, if you manage to keep that percentage high throughout the year, you are a good putter and will likely have high finishes.
Is putting important?
Now it is time to write down the learnings from all this information we just gathered and give you an idea of how to separate a player that had a good putting week, from a player that is brilliant on the greens throughout the year.
Obviously, weekly performances are easier to compare to each other because everyone encountered similar conditions. You probably noticed that some of the players popped up in various stats, even the ones that we determined to be not fit for comparison. While the stats are sometimes not comparable within themselves, chances are that a player who pops up in multiple stats does underline the general notion of a player having had a good putting week or not. There is no single stat to look at in order to figure out who was the best putter for a specific week. As mentioned above all of the stats have flaws and leave out important parts of reality. However, if you look at a combination of the following statistics per tournament, you will have a good idea of who outperformed his fellow competitors on the green. Those statistics are: Strokes Gained Putting, Putting from 10-15 feet, Green in Regulation 10-15 feet, Total Putting, Putting Average, and the Birdie Conversion Rate. Taking into account those stats for the Players Championship the players with the best overall putting performance were Bryan Harman and Paul Casey because they managed to appear in almost all of those stats within the Top 3.
If you want to do the same for world rankings, the best combination of stats to look at are Putting Average and Birdie Conversion Rate, because they are the least influenced by other factors, and despite the fact they do not factor in distance or difficulty, they hold the test of time. Why? Because throughout a season you will eventually have shorter putts, longer putts, and more difficult putts, if you are able to keep your average and conversion rate low, you will gain an advantage over others. Furthermore, just like with the statistics per tournament, you will see players that perform well in those two stats, also pop up near the top of the board in other categories even if those stats are not comparable within themselves. Again, it simply underlines the assumption of a player being a good putter, the categories by themselves just won’t help you make those conclusions. Having looked at all those stats the best overall putter, using the available data, is world number seven Patrick Reed, who popped up on various other stats and is second in both categories we named above. Having said that, you might have noticed, that being a good putter ultimately does not guarantee good world rankings. Directly contradicting the notion of putting being the most important aspect of a player’s game. But keep in mind: coming down the stretch of a tournament, it will eventually come down to that last putt. So you better make sure, that your confidence level on the greens is high enough to convert that last putt for the win.